Result update| Luggage
August 18, 2018
Safari Industries
BUY
CMP
`868
Another blockbuster quarter…
Target Price
`1000
Robust growth in revenue: For Q1FY2019, Safari Industries (Safari) posted a yoy
Investment Period
12 Months
growth of 49% growth in revenue mainly led by volume growth and low base
Stock Info
effect (Q1FY2018 revenue was subdued due to GST impact). The company has
Sector
Luggage
reported net revenue of `156 cr which was the highest ever revenue achieved.
Market Cap (` cr)
1,934
The company is garnering market share from the unorganized market and seeing
Net Debt (` cr)
52
good demand in its backpacks and new categories which is driving such strong
Beta
0.3
growth in its financials.
52 Week High / Low
898/285
Margins almost doubled on yearly basis: OPM has almost doubled on yearly
Avg. Daily Volume
8,776
Face Value (`)
2
basis to 13.9% led by operating leverage and better product mix. On quarterly
BSE Sensex
37,947
basis also, Margins have improved by over 200 bps on a strong base. The
Nifty
11,470
company is expecting 100-200 basis margin expansion on yearly basis. Looking
Reuters Code
SAFA.BO
at the good demand environment, the company is also planning to move into
Bloomberg Code
SII.IN
premium luggage segment and could soon launch some product in this category.
Earlier, Safari was in wait and watch mode for this category.
Shareholding Pattern (%)
PAT rose by 272% yoy: With a moderate rise in interest and depreciation, PAT
Promoters
57.8
grew to `12.2 cr, a growth of 272% yoy and 58% qoq.
MF / Banks / Indian Fls
15.8
Outlook and Valuation: We remained convinced about its long term growth story
FII / NRIs / OCBs
8.7
as the company is in sweet spot in a fast growing luggage industry. We have
Indian Public / Others
17.7
upgraded our estimates by 30-33%, in view of its improving growth and margin
outlook. We are now expecting a CAGR of ~30%/60% in revenue/ earnings over
Nidhi Agrawal
FY18-20E. The stock has given 67% return since our initiation in April and is
022-39357800 Ext: 6872
currently trading at 35x our revised FY2020 earnings, which is still attractive
looking at its robust growth trajectory. Hence, we recommend BUY with a target
price of `1000 (40x FY2020E EPS).
Key Financials
Y/E March (` cr)
FY2016
FY2017E
FY2018E
FY2019E
FY2020E
Net Sales
278
359
415
540
702
% chg
28.8
29.0
15.8
30.0
30.0
Net Profit
7.8
10.4
21.2
40.8
54.6
% chg
55.9
33.8
103.9
92.3
33.8
OPM (%)
6.7
6.3
9.8
12.9
12.9
EPS (Rs)
3.5
4.7
9.5
18.3
24.5
P/E (x)
248.2
185.5
91.0
47.3
35.4
P/BV (x)
15.0
13.6
7.9
6.5
5.2
RoE (%)
8.5
10.4
12.3
19.4
21.0
RoCE (%)
9.7
12.1
15.2
23.6
26.0
EV/Sales (x)
7.1
5.5
4.8
3.6
2.8
EV/EBITDA (x)
107.2
87.7
48.5
28.0
21.7
Source: Company, Angel Research
Please refer to important disclosures at the end of this report
1
Safari Industries |Result Update
Exhibit 1: Quarterly results at a glance
Rs cr
Q1FY18
Q2FY18
Q3FY18
Q4FY18
Q1FY19
YoY
QoQ
Net Sales
104
88
103
119
156
49%
31%
YoY growth %
25.6%
19.2%
11.5%
25.9%
49.2%
Total expenditure
98
80
91
105
134
37%
27%
Raw Material Consumed
8
6
9
19
17
114%
-7%
Stock Adjustment
8
-1
-13
-12
0
-
-96%
Purchase of Finished Goods
48
39
59
57
70
45%
23%
Employee Expenses
12
13
13
15
16
30%
5%
Other Expenses
22
24
24
27
32
45%
17%
As a % of sales
Raw Material Consumed
8%
7%
8%
16%
11%
Stock Adjustment
7%
-1%
-13%
-10%
0%
Purchase of Finished Goods
46%
44%
57%
48%
45%
Gross margin %
39%
50%
48%
47%
44%
Employee Expenses
12%
14%
13%
13%
10%
Other Expenses
21%
27%
23%
23%
20%
Total expenditure
94%
91%
88%
88%
86%
Operating profit
6.6
8.0
12.3
13.8
21.6
226%
56.2%
Other Income
0.2
0.2
0.5
0.7
0.3
49%
-55.3%
PBIDT
6.8
8.2
12.8
14.5
21.9
221%
50.8%
Interest
0.5
0.7
0.9
0.7
1.0
91%
45.7%
Depreciation
1.4
1.3
2.0
1.4
1.9
39%
33.3%
PBT
4.9
6.1
9.9
12.4
19.0
285%
53.2%
Tax
1.8
2.6
3.3
4.3
6.8
273%
58.4%
Adjusted Profit
3.3
3.5
6.8
7.7
12.2
272%
58.9%
YoY growth %
61.1%
152.5%
128.3%
150.2%
272.0%
Ratios
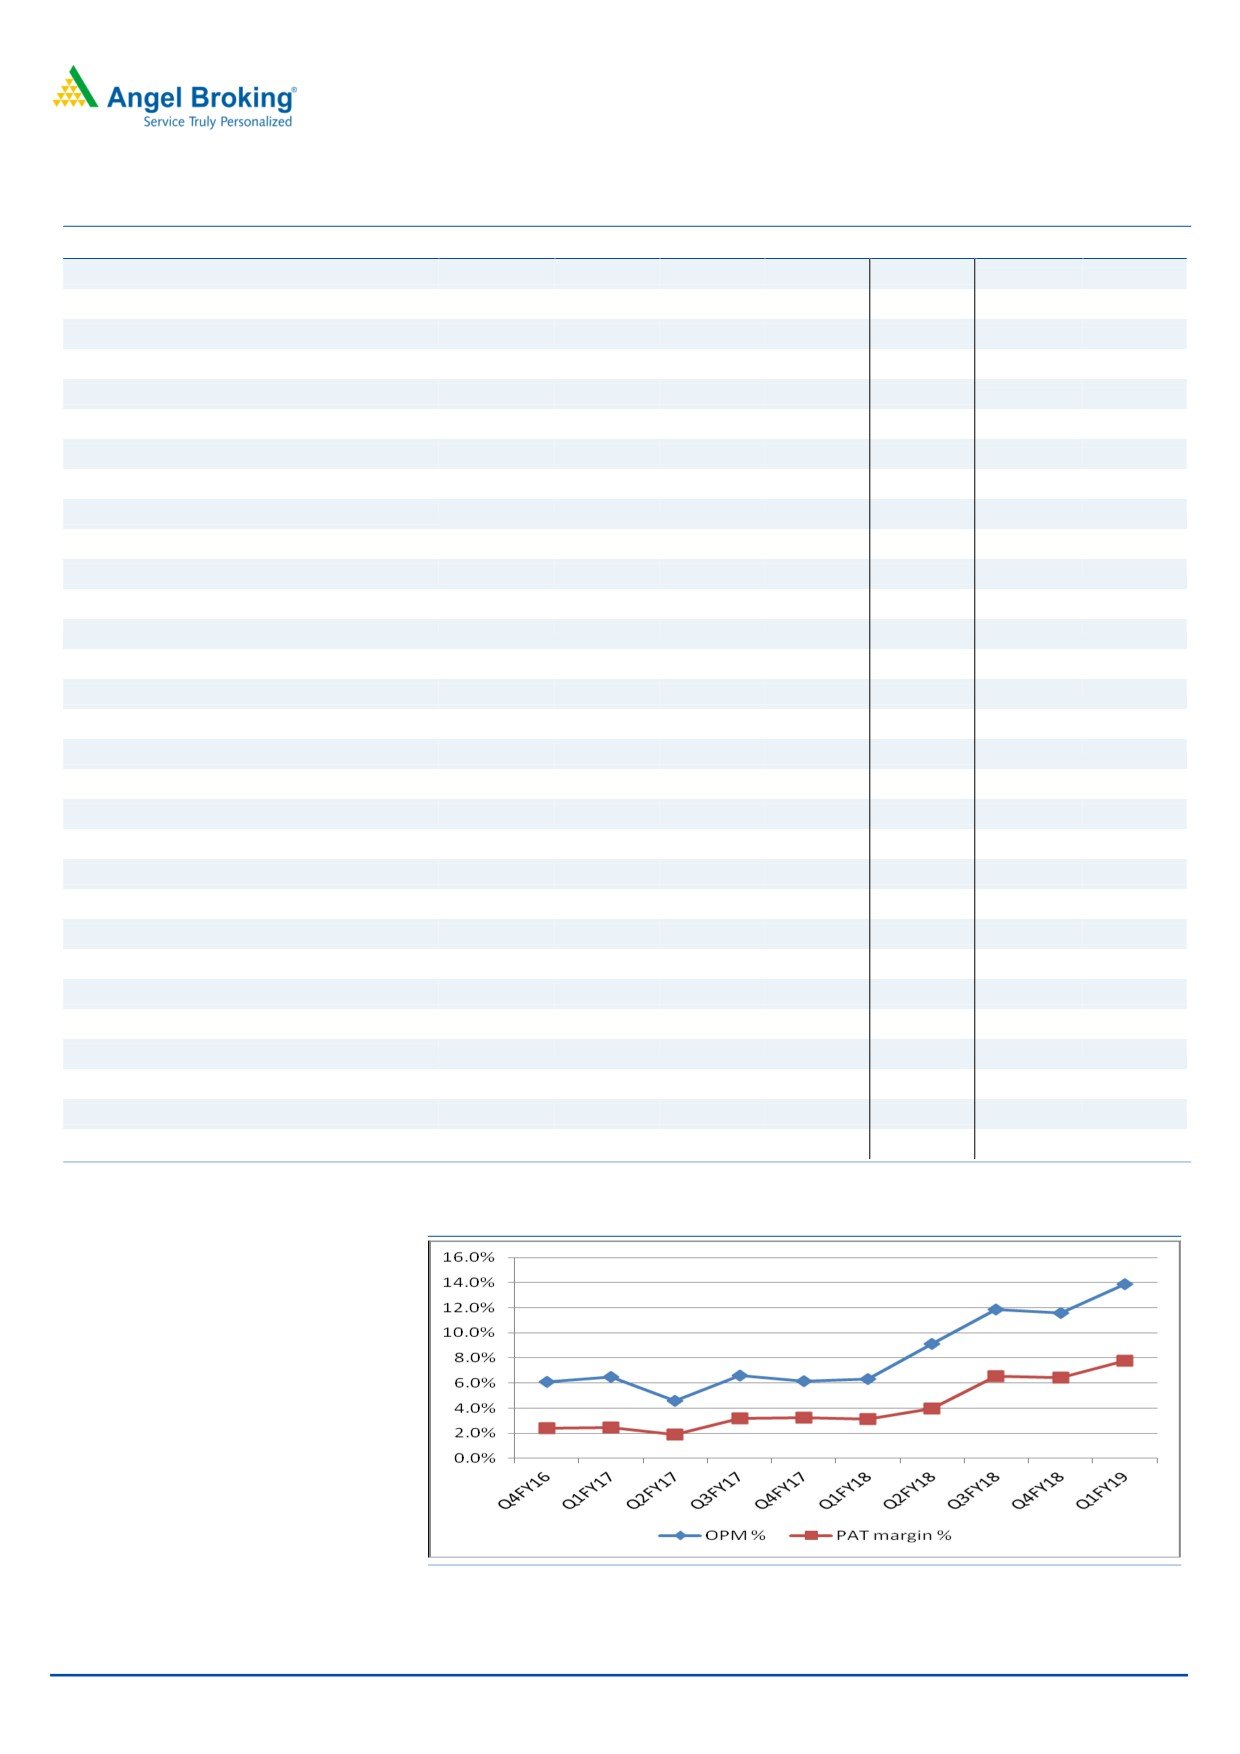
OPM %
6.3%
9.1%
11.9%
11.6%
13.9%
PAT margin %
3.1%
4.0%
6.6%
6.4%
7.8%
Tax rate %
37%
42%
34%
34.7%
35.9%
Source: Company
Exhibit 2: Margins are on uptrend
Source: Company, Angel Research
August 18, 2018
2
Safari Industries |Result Update
Risks to our estimates
Volatility in foreign currency could impact the company’s profitability (77% of
its revenue comes from soft luggage, which is imported from China).
With closure of many luggage units in China (owing to pollution concerns),
the surviving suppliers have started taking price hikes which is could put
pressure on its margins, unless price hike is taken.
Increase in competition from unorganized players would impact overall
growth of the company
Safari’s 23% sales comes from hard luggage segment and any increase in
input cost (most of the key raw material is polypropylene and aluminum)
could negatively impact profitability
August 18, 2018
3
Safari Industries |Result Update
Profit & Loss Statement
Y/E March (` cr)
FY2016
FY2017
FY2018E
FY2019E
FY2020E
Total operating income
278
359
415
540
702
% chg
28.8
29.0
15.8
30.0
30.0
Total Expenditure
260
336
375
470
611
Raw Material
173
219
226
298
387
Personnel
29
41
53
59
77
Selling and Administration Expenses
48.1
65.4
96.2
97.2
126.4
Others Expenses
9
10
-
16
21
EBITDA
19
22
41
70
91
% chg
63.1
21.3
81.6
71.2
30.0
(% of Net Sales)
6.7
6.3
9.8
12.9
12.9
Depreciation& Amortisation
4
5
6
7
7
EBIT
14
17
35
63
83
% chg
70.7
20.0
99.9
81.8
32.4
(% of Net Sales)
5.2
4.8
8.3
11.7
11.9
Interest & other Charges
3
3
3
4
4
Other Income
1
1
2
2
2
(% of PBT)
6.5
7.4
4.6
3.1
2.7
Share in profit of Associates
-
-
-
-
-
Recurring PBT
12
15
33.4
61
82
% chg
105.9
25.2
123.1
82.7
33.8
Tax
4
5
12
20
27
(% of PBT)
35.2
34.1
36.4
33.0
33.0
PAT (reported)
8
10
21
41
55
Extraordinary Items
(0)
(1)
-
-
-
ADJ. PAT
8
10
21
41
55
% chg
55.9
33.8
103.9
92.3
33.8
(% of Net Sales)
2.8
2.9
5.1
7.6
7.8
Fully Diluted EPS (Rs)
3.5
4.7
9.5
18.3
24.5
% chg
55.9
33.8
103.9
92.3
33.8
Source: Company, Angel Research
August 18, 2018
4
Safari Industries |Result Update
Consolidated Balance Sheet
Y/E March (` cr)
FY2016
FY2017
FY2018E FY2019E FY2020E
SOURCES OF FUNDS
Equity Share Capital
4
4
4
4
4
Reserves& Surplus
87
96
168
206
256
Shareholders Funds
91
100
173
210
260
Equity Share Warrants
-
-
-
-
-
Total Loans
58
44
54
57
60
Deferred Tax Liability
-
-
0
-
-
Total Liabilities
149
143
228
267
320
APPLICATION OF FUNDS
Gross Block
42
45
60
70
80
Less: Acc. Depreciation
18
22
28
35
42
Net Block
24
23
31
35
37
Capital Work-in-Progress
0
1
0
1
1
Investments/ Other NC assets
0
-
6
-
-
Current Assets
143
165
244
295
359
Inventories
76
94
123
156
199
Sundry Debtors
54
58
104
89
115
Cash
5
5
3
32
21
Loans & Advances
8
7
2
2
3
Other Assets
-
-
13
16
20
Current liabilities
27
54
53
64
77
Net Current Assets
116
110
190
232
282
Deferred Tax Asset
(0)
(0)
-
-
-
Total Assets
149
143
228
267
320
August 18, 2018
5
Safari Industries |Result Update
Consolidated Cash flow Statement
Y/E March (` cr)
FY2016
FY2017
FY2018E FY2019E FY2020E
Profit before tax
12
15
33
61
82
Depreciation
4
5
6
7
7
Change in Working Capital
0
0
(79)
(7)
(62)
Interest / Dividend (Net)
3
3
3
4
4
Direct taxes paid
(4)
(5)
(12)
(20)
(27)
Others
(28)
4
42
1
0
Cash Flow from Operations
(13)
22
(6)
47
4
(Inc.)/ Dec. in Fixed Assets
(16)
(5)
(5)
(10)
(10)
(Inc.)/ Dec. in Investments
1
(1)
0
0
0
Cash Flow from Investing
(15)
(6)
(5)
(10)
(10)
Issue of Equity
7
0
0
0
0
Inc./(Dec.) in loans
3
1
11
3
3
Dividend Paid (Incl. Tax)
0
(16)
(2)
(3)
(5)
Interest / Dividend (Net)
(3)
(3)
(3)
(4)
(4)
Cash Flow from Financing
29
(17)
6
(5)
(6)
Inc./(Dec.) in Cash
1
(2)
(5)
32
(11)
Opening Cash balances
3
4
5
0
32
Closing Cash balances
4
2
0
32
21
August 18, 2018
6
Safari Industries |Result Update
Key Ratios
Y/E March
FY2016
FY2017
FY2018E FY2019E FY2020E
Valuation Ratio (x)
P/E (on FDEPS)
248.2
185.5
91.0
47.3
35.4
P/CEPS
115.3
90.9
49.8
28.6
22.0
P/BV
15.0
13.6
7.9
6.5
5.2
Dividend yield (%)
0.0
0.0
0.1
0.2
0.2
EV/Sales
7.1
5.5
4.8
3.6
2.8
EV/EBITDA
107.2
87.7
48.5
28.0
21.7
EV / Total Assets
13.3
13.7
8.7
7.3
6.2
Per Share Data- `
EPS (Basic)
3.5
4.7
9.5
18.3
24.5
EPS (fully diluted)
3.5
4.7
9.5
18.3
24.5
Cash EPS
5.3
6.7
12.3
21.4
27.9
DPS
0.2
0.4
0.8
1.5
2.1
Book Value
40.9
44.9
77.7
94.5
117.0
Returns (%)
ROCE
9.7
12.1
15.2
23.6
26.0
Angel ROIC (Pre-tax)
10.0
12.5
15.8
26.7
27.8
ROE
8.5
10.4
12.3
19.4
21.0
Turnover ratios (x)
Asset Turnover (Gross Block)
6.6
7.9
7.0
7.8
8.8
Inventory / Sales (days)
100
96
108
106
104
Receivables (days)
71
59
91
60
60
Payables (days)
92
141
114
114
114
Working capital cycle (ex-cash) (days)
80
14
85
52
50
Source: Company, Angel Research
August 18, 2018
7
Safari Industries |Result Update
Research Team Tel: 022 - 39357800
DISCLAIMER
DISCLAIMER
Angel Broking Limited (hereinafter referred to as “Angel”) is a registered Member of National Stock Exchange of India Limited, Bombay
Stock Exchange Limited, Metropolitan Stock Exchange Limited, Multi Commodity Exchange of India Ltd and National Commodity &
Derivatives Exchange Ltd It is also registered as a Depository Participant with CDSL and Portfolio Manager and Investment Adviser with
SEBI. It also has registration with AMFI as a Mutual Fund Distributor. Angel Broking Limited is a registered entity with SEBI for Research
Analyst in terms of SEBI (Research Analyst) Regulations, 2014 vide registration number INH000000164. Angel or its associates has not
been debarred/ suspended by SEBI or any other regulatory authority for accessing /dealing in securities Market. Angel or its
associates/analyst has not received any compensation / managed or co-managed public offering of securities of the company covered
by Analyst during the past twelve months.
This document is solely for the personal information of the recipient, and must not be singularly used as the basis of any investment
decision. Nothing in this document should be construed as investment or financial advice. Each recipient of this document should make
such investigations as they deem necessary to arrive at an independent evaluation of an investment in the securities of the companies
referred to in this document (including the merits and risks involved), and should consult their own advisors to determine the merits and
risks of such an investment.
Reports based on technical and derivative analysis center on studying charts of a stock's price movement, outstanding positions and
trading volume, as opposed to focusing on a company's fundamentals and, as such, may not match with a report on a company's
fundamentals. Investors are advised to refer the Fundamental and Technical Research Reports available on our website to evaluate the
contrary view, if any
The information in this document has been printed on the basis of publicly available information, internal data and other reliable
sources believed to be true, but we do not represent that it is accurate or complete and it should not be relied on as such, as this
document is for general guidance only. Angel Broking Limited or any of its affiliates/ group companies shall not be in any way
responsible for any loss or damage that may arise to any person from any inadvertent error in the information contained in this report.
Angel Broking Limited has not independently verified all the information contained within this document. Accordingly, we cannot testify,
nor make any representation or warranty, express or implied, to the accuracy, contents or data contained within this document. While
Angel Broking Limited endeavors to update on a reasonable basis the information discussed in this material, there may be regulatory,
compliance, or other reasons that prevent us from doing so.
This document is being supplied to you solely for your information, and its contents, information or data may not be reproduced,
redistributed or passed on, directly or indirectly.
Neither Angel Broking Limited, nor its directors, employees or affiliates shall be liable for any loss or damage that may arise from or in
connection with the use of this information.
Disclosure of Interest Statement
Safari Industries
1. Analyst ownership of the stock
No
2. Angel and its Group companies ownership of the stock
No
3. Angel and its Group companies' Directors ownership of the stock
No
4. Broking relationship with company covered
No
Note: We have not considered any Exposure below ` 1 lakh for Angel, its Group companies and Directors
Ratings (Returns):
Buy (> 15%)
Accumulate (5% to 15%)
Neutral (-5 to 5%)
Reduce (-5% to -15%)
Sell (< -15%)
August 18, 2018
8